Link table
Summary and 1 Introduction
2 related works
2.1 Program summary
2.2 Creativity support tools for animation
2.3 Generative tools for design
3 training stages
4 logomotion and input system 4.1
4.2 Visual pre-process information
4.3 Visually grounded code synthesis
5 reviews
5.1 Evaluation: Program repair
5.2 Methodology
5.3 Results
6 Assessment with beginners
7 Discussion and 7.1 Breaking with models
7.2 Generating code around the visual
7.3 Limitations
8 Conclusion and references
5.3 Results
5.3.1 RQ3. What errors does Logomotion synthesis make? Logomotion made 42 position-based errors in total. Position errors were made in 30.4% of runs, meaning that almost all of the runs with errors detected a position error. These errors occurred when the left or top coordinate of the bounding box was off. Logomotion made 26 scale-based errors in total, missing in 18.4% of runs, meaning that scale errors were less common than position errors. These errors occurred when the width or height dimensions of the bounding box were off. We did not detect any opacity errors in our test set.
Common errors resulted from not following the From-to format common to animation libraries (CSS and Anime.js). Despite the prompt suggesting a from-to-to format, keyframes would often be suggested with arrays that had more than two values, so that the element would not return to its original position. For example,
If the generated animation sets translation values to [10,-10, 0]–the element would end up with a -10 offset from its correct position.
Another type of position error would occur when there was inconsistent application of absolute and relative percentages. For example, a line layer in an animation might be instructed to extend from 0% outward to 100%. This 100% was intended to be relative to the width or height of the element, but was rendered as 100% (absolute relative to the screen). An example of this error in the LLM response is provided below.
“I made an assumption to change the ‘translator’ value from “41.1%” to “50%”, assuming that “50%” corresponds to the centered position in the layout.”
Another type of error that was frequently encountered was when GPT would return a looping animation. Looping animations, as briefly mentioned in our formative steps, are a common design pattern for animation and would be instantiated by defining a small periodic action with the loop parameter set to true. Looping elements often left elements at small deltas from their intended positions, but were easily resolved.
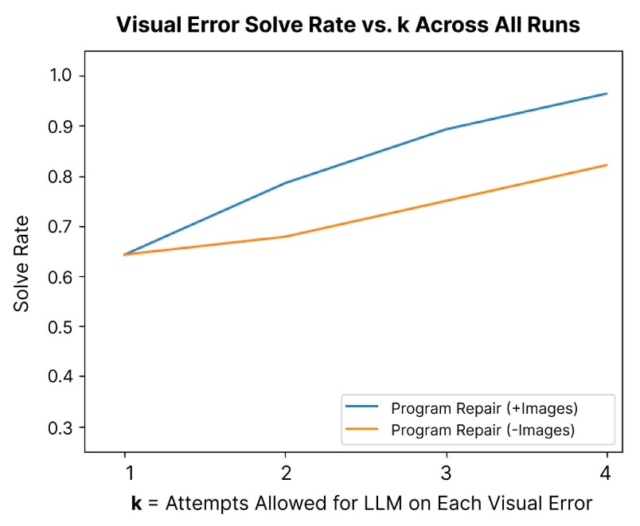
5.3.2 RQ4. How capably did Logomotion fix errors? Many errors were simple enough that they only took Logomotion one attempt to resolve. This is depicted in Figure 8 by the predominance of the green bar for “resolved at 1” for each value of 𝑘. Note that Figure 7 normalizes the number of elements, because it reports the proportion of animation code that executed without errors, while Figure 8 aggregates across all errors across all design elements. This distinction is important because the run that could not be resolved (Figure 7, k = 4) had many elements whose individual errors were not resolved (Figure 8, at k = 4), making the resolution rate different at k = 4 in the graphs.


